QML Profiling Plasmashell (Out of Date)
Update: There is now an easier way to debug plasmashell. You no longer need to compile plasma-workspace in Qt Creator to debug plasmashell.
Please read this article on how to use the qmlprofiler command to create .qtd files you can load in Qt Creator.
A while back I figured out how to use Qt Creator’s QML Profiler to check my widgets. I imported the plasma-sdk repository which contains the plasmoidviewer process.
More recently I wondered if I could do the same to the full plasmashell process. First off is finding out which of KDE’s hundreds of repository’s owns the plasmashell process.
$ which plasmashell
/usr/bin/plasmashell
$ dpkg -S `which plasmashell` # Kubuntu/KDE Neon
plasma-workspace: /usr/bin/plasmashell
$ pacman -Qo `which plasmashell` # Arch/Manjaro
/usr/bin/plasmashell is owned by plasma-workspace
Source Code and Dependencies
Okay lets try cloning the plasma-workspace package.
mkdir ~/kde/src/plasma
cd ~/kde/src/plasma
git clone https://invent.kde.org/plasma/plasma-workspace.git
cd plasma-workspace
Note: You can clone the GitHub mirror (https://github.com/KDE/plasma-workspace.git) if you find the KDE servers too slow.
Next up is checking we have all the build dependencies installed. In Kubuntu it’s as simple as running:
sudo apt-get build-dep plasma-workspace
For Arch/Manjaro, try looking at the PKGBUILD for the makedepends packages.
- https://github.com/archlinux/svntogit-packages/blob/packages/plasma-workspace/trunk/PKGBUILD
- https://aur.archlinux.org/cgit/aur.git/tree/PKGBUILD?h=plasma-workspace-git
Once you have those installed, you should be able to compile the project.
cmake -B build -DCMAKE_INSTALL_PREFIX=/usr -DCMAKE_INSTALL_LIBDIR=lib -DCMAKE_INSTALL_LIBEXECDIR=lib -DBUILD_TESTING=OFF
cmake --build build
Note that you can speed things up with --parallel to use all CPU Cores instead of just 1 core. You can also use --parallel 5 to use 5 CPU cores. I have a 6 core CPU so that leaves 1 core for the OS + Firefox while waiting.
cmake --build build --parallel 5
If you run into an error, it might be because you are on the master branch containing code for the next version of Plasma. You may need to checkout the git branch for your current version of Plasma. Then run the build commands again.
git checkout Plasma/5.21
If the project reached [100%] Built target ... then it compiled successfully. We can now delete the ./build directory since Qt Creator won’t reuse it.
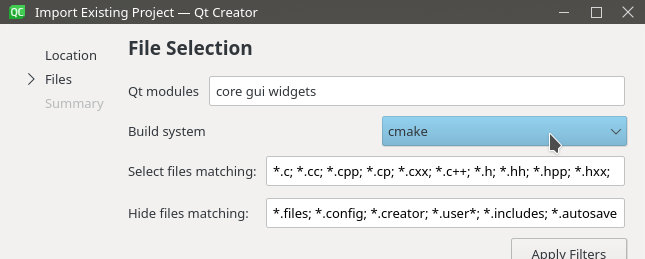
Qt Creator Project Import
Now we can finally import the project in Qt Creator.
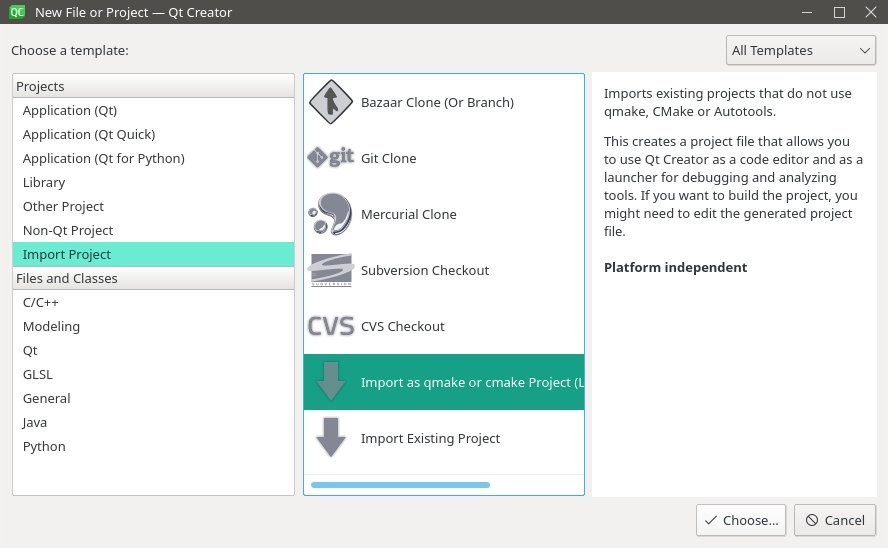
File > New File or Project (Ctrl+N)
Import Project > Import as qmake or cmake Project
- Name:
plasma-workspace - Location:
/home/chris/kde/src/plasma/plasma-workspace
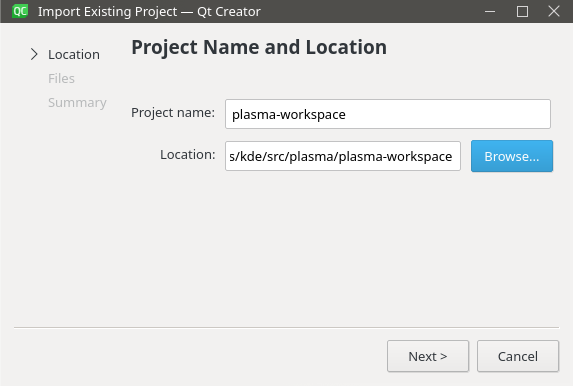
- Build system:
cmake
On the final screen, you’ll notice that it says it’s going to generate a CMakeLists.txt file. Unfortunately this would overwrite our existing file, so before clicking finish, rename the existing CMakeLists.txt file to CMakeLists-orig.txt. Once you’ve done so, click Finish.
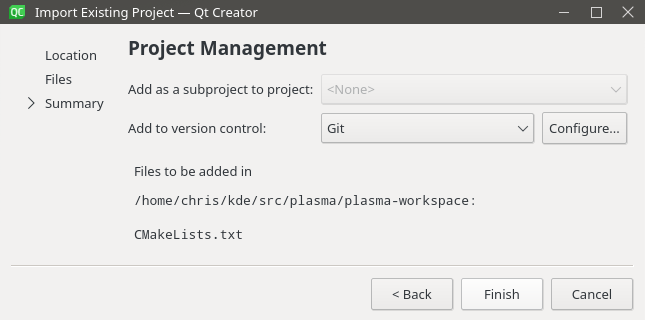
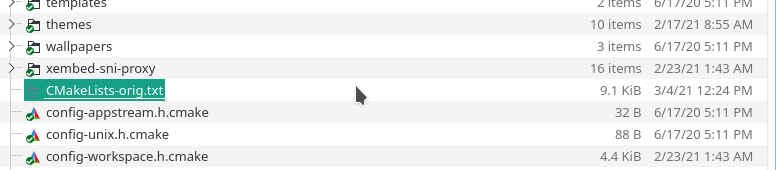
Lastly, we need to delete the CMakeLists.txt generated by Qt Creator, then rename the CMakeLists-orig.txt back to CMakeLists.txt.
Qt Creator Project Config
Now to configure the Qt Creator project. The first thing you need to do is click the “Configure Project” button to confirm that we want to use the default Qt version to compile the project.
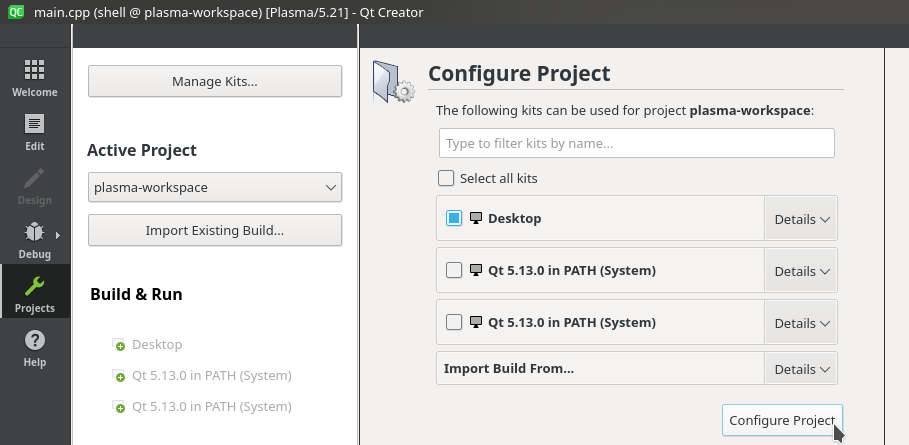
Next we want to configure the Build and Run. Click the Project tab on the left sidebar.
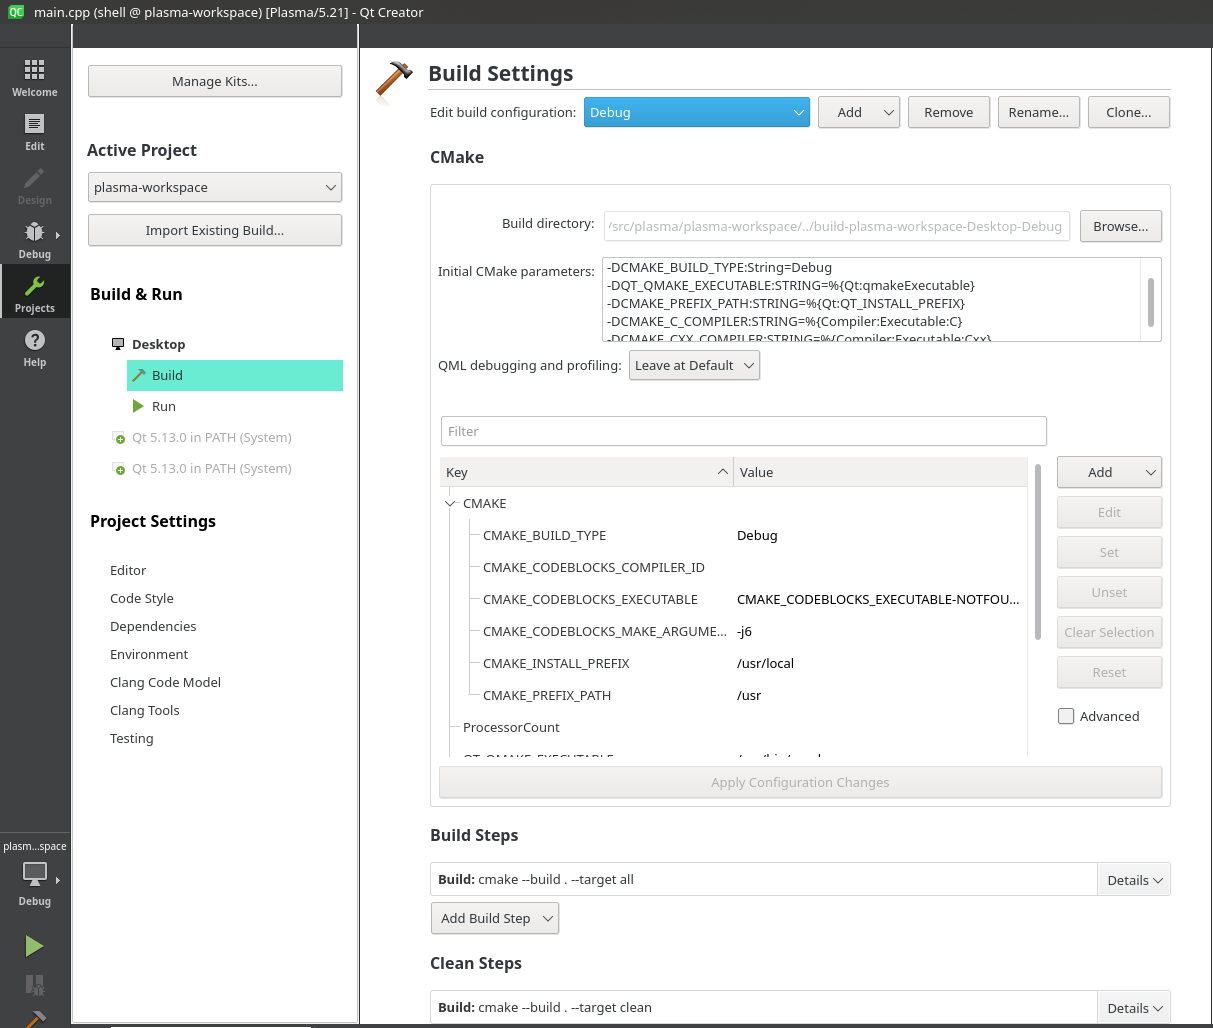
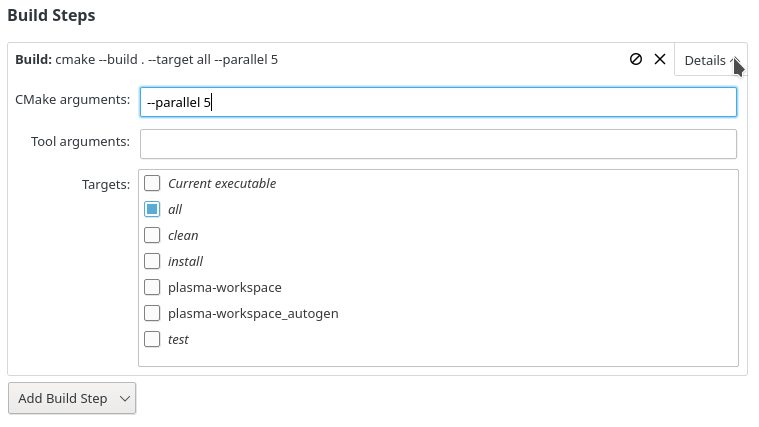
By default, Qt Creator will only use 1 CPU core to compile the project. So like before, we’ll edit the cmake command to use --parallel 5.
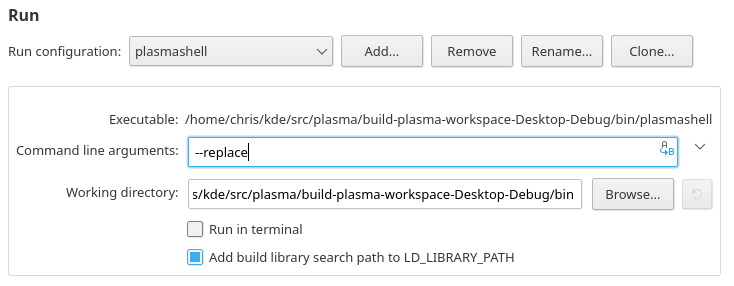
Next we need to configure the Run command. Click the “Run” settings section.
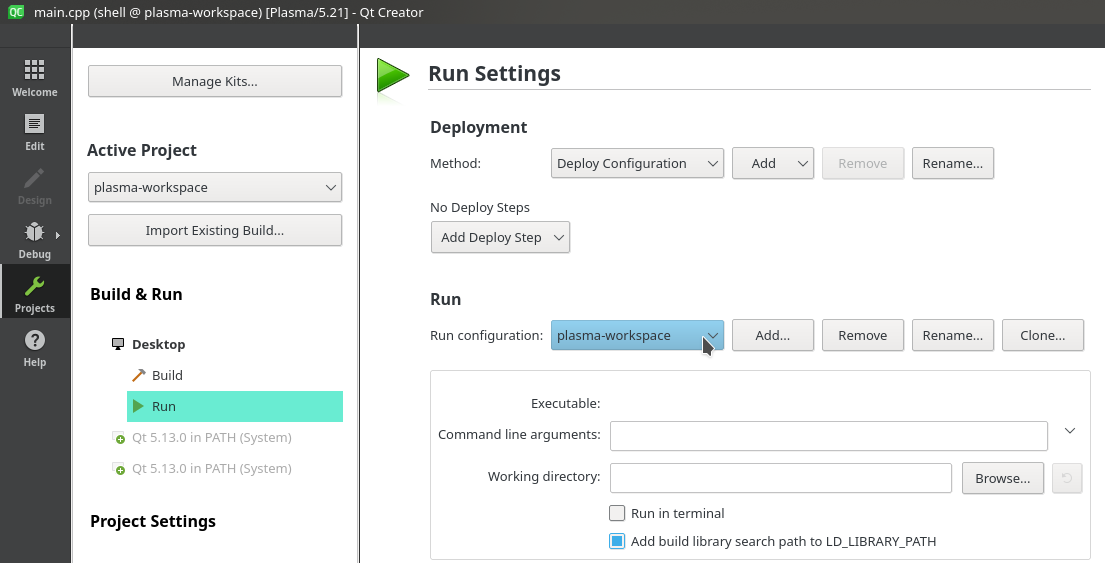
The plasma-workspace git repository contains a dozen or so executable programs in it. So we need to specify that we want to test the plasmashell process.
We need to change the “Run Configuration” from plasma-workspace to plasmashell.
We also want to add --replace to the “command line arguments” so that we cleanly terminate the existing plasmashell process.
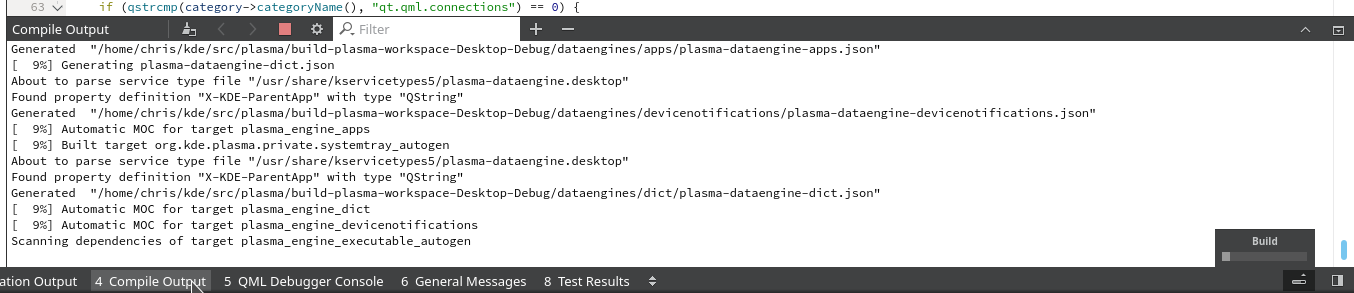
Now hit the green triangle in the bottm left to Run (Ctrl+R) the project.
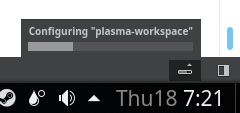
Click “Compile Output” in the bottom to watch it go. Since it’s the first time (in Qt Creator) it’ll take a while, but consecutive runs should be faster.
When it finally runs, your panel will disappear, then reappear.
If does not reappear after a minute for some reason, run the following command in KRunner (Alt+Space).
killall plasmashell ; kstart5 plasmashell
If all went well and the panel reappeared correctly after we clicked “Run” in Qt Creator, we can move on to debugging!
Debugging
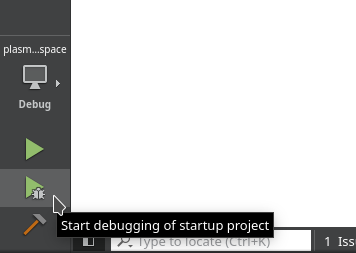
We can press the “Run” icon with the bug on it to run the project with the gdb debugger.
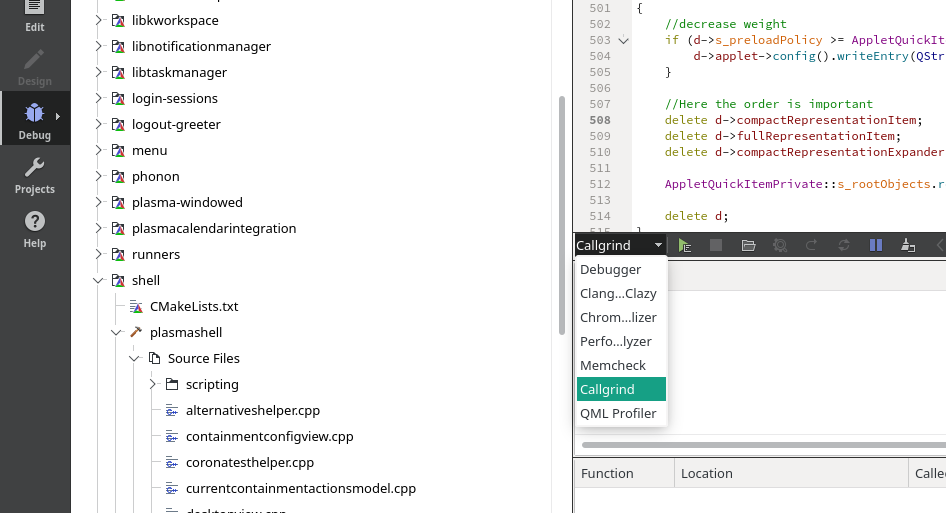
If you click on the “Debug” tab in the sidebar, you’ll see a GUI for the GDB debugger.
While it’s very useful for stepping through C++ code line by line, but it is not helpful for debugging QML.
You can click the “Debugger” dropdown to switch to “Memcheck” (valgrind) or Callcheck (valgrind --tool=callgrind). Both are very slow to run.
valgrind is a pretty useful tool. I’ve run it’s --tool=massif in the terminal before to check the memory allocation. I then ran plasmashell --replace afterwards so terminate the “valgrind” plasmashell so it would generate a massif.out.131374 file. You can open these files in massif-visualizer.
valgrind --tool=massif plasmashell --replace
plasmashell --replace # Ran in another Tab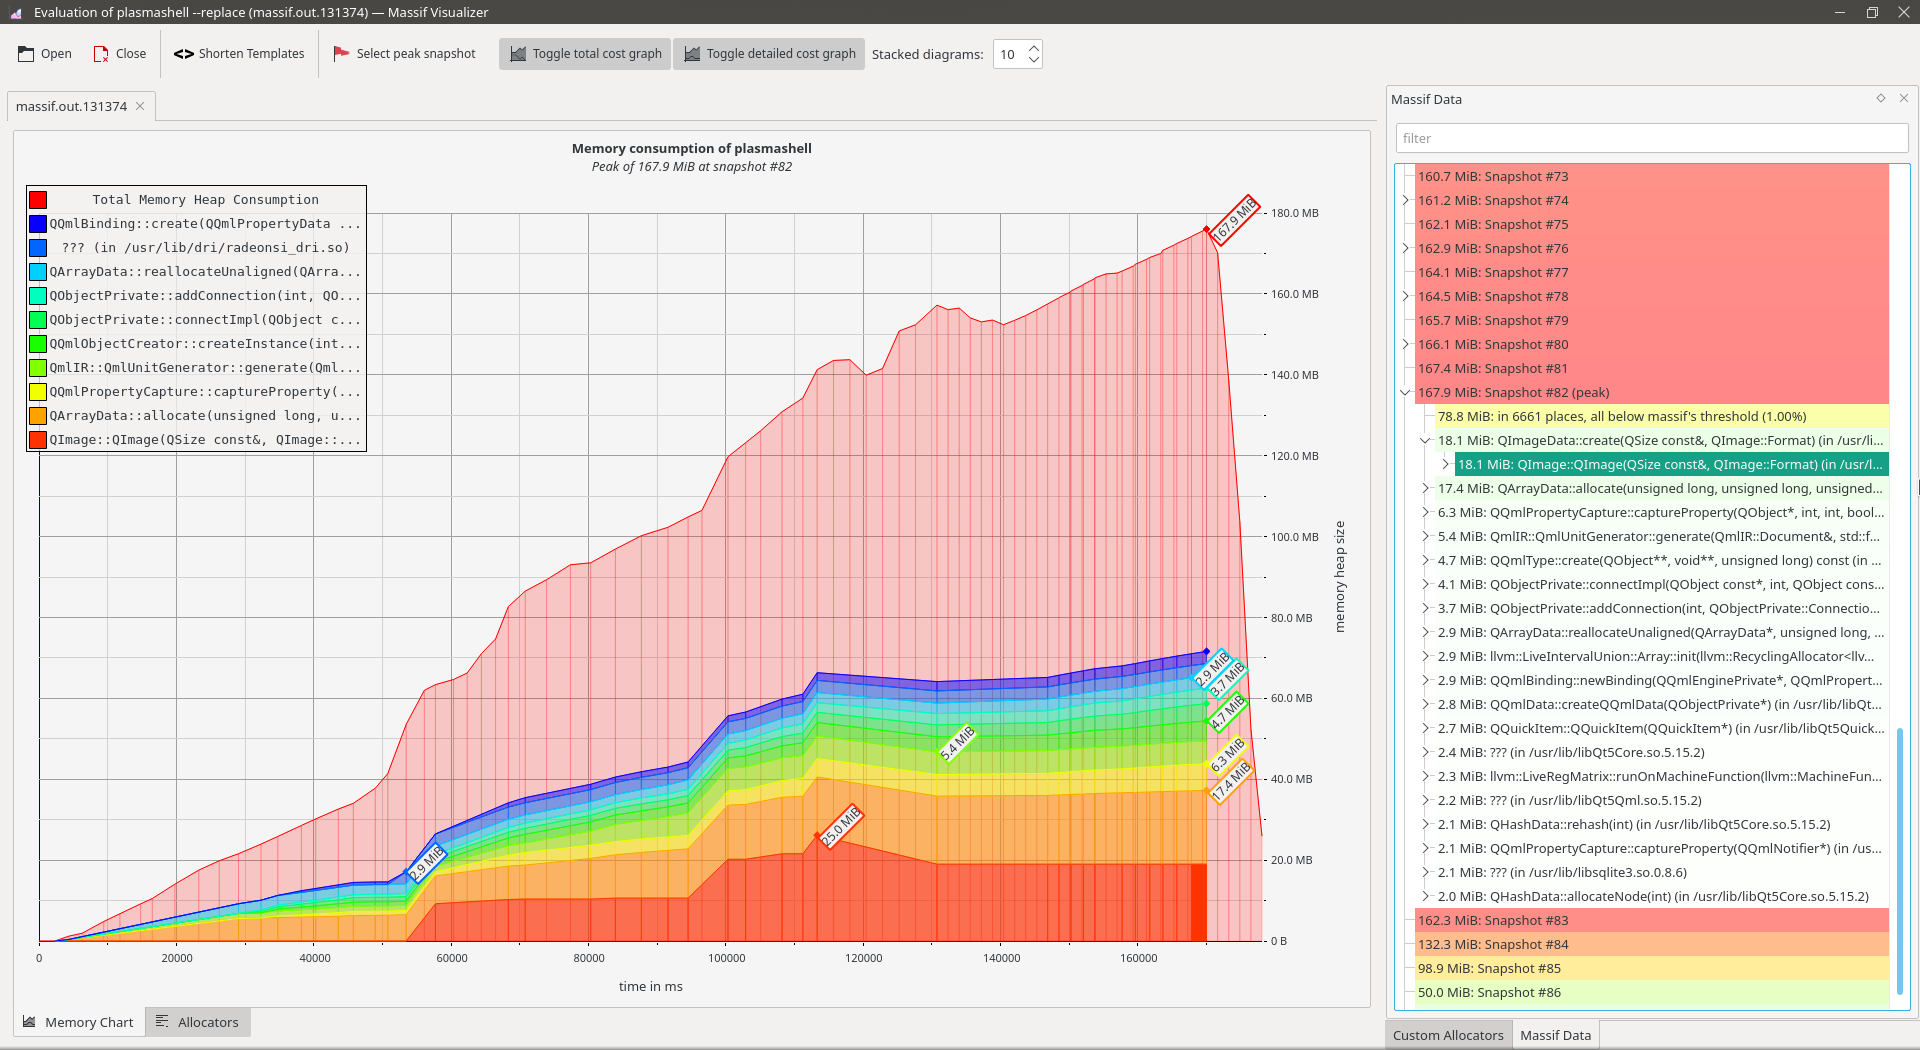
Unfortunately, massif is also very slow to run plasmashell. Perhaps someday I’ll figure out how to make it start plasmashell normally, then begin taking snapshots when it RAM usage creeps up. Right now it’s starts Plasma so slowly that a number of services timeout.
We need something we can toggle on/off with a GUI. Like Qt Creator’s QML profiler!
QML Debugging
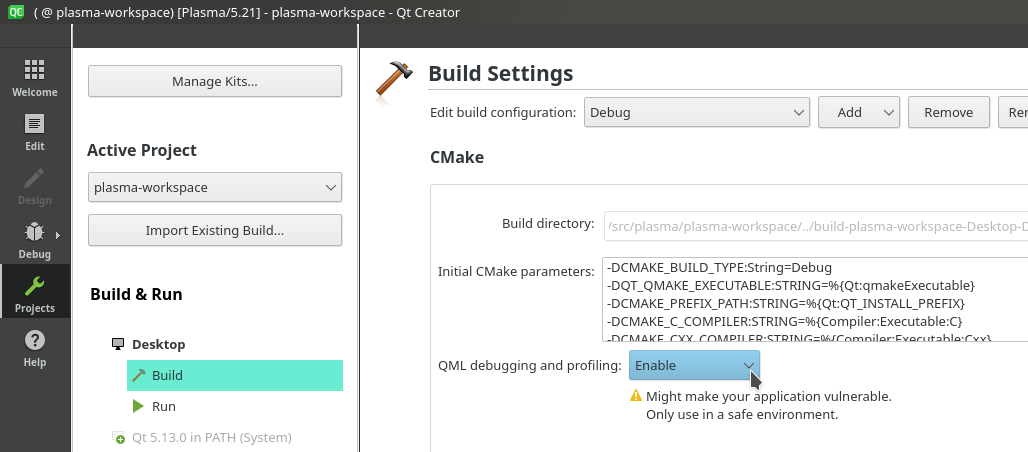
To launch Qt Creator’s QML debugger, you will need to go back to the project’s Build configuration to change “QML debugging and profiling” from “Leave at Default” to “Enable”.
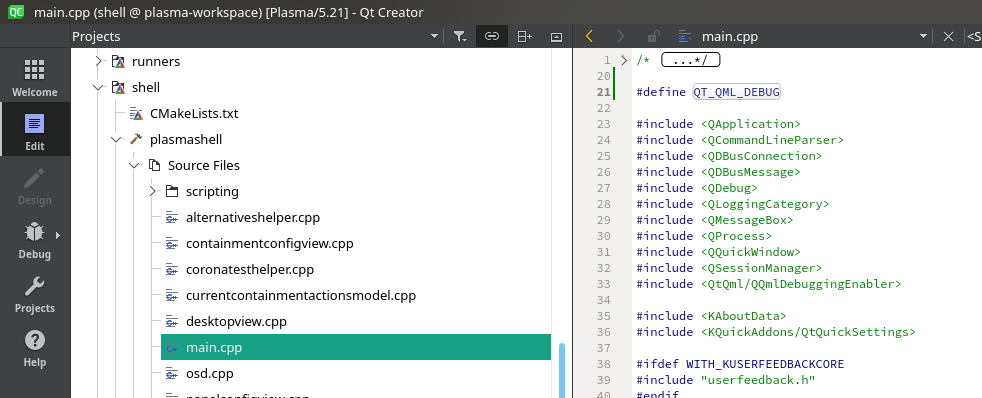
Since we’re also using a CMake project, the Qt QML Debugging documentation mentions we need to define QT_QML_DEBUG for the compiler. This step stumped me for a while until I read an old changelog that mentioned this commit in Discover.
So open up shell/main.cpp (shell > plasmashell > Source Files > main.cpp) and add #define QT_QML_DEBUG to the top of the file.
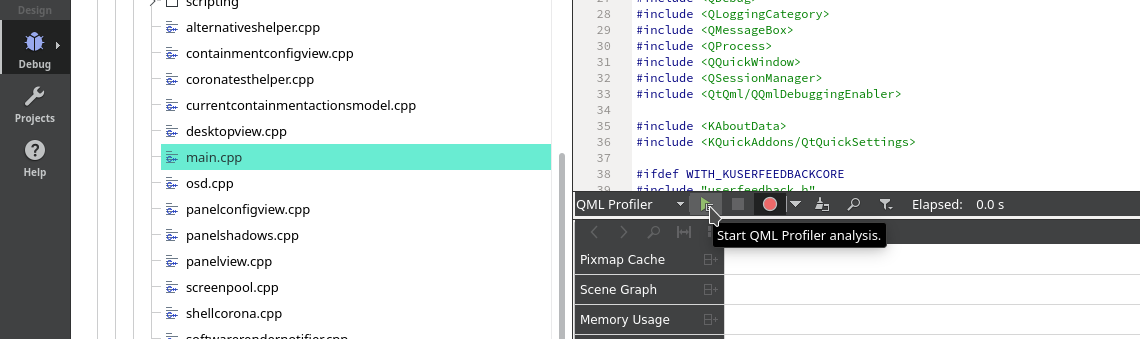
Now select “QML Profiler” in the Debug tab dropdown. Then “Start QML Profiler analysis”. It’ll take a second, but is way faster than valgrind.
After about 30 seconds, I clicked the circle “Stop Profiling” button. Do not press the square “Stop” button or plasmashell will be terminated. You can stop and start profiling as needed!
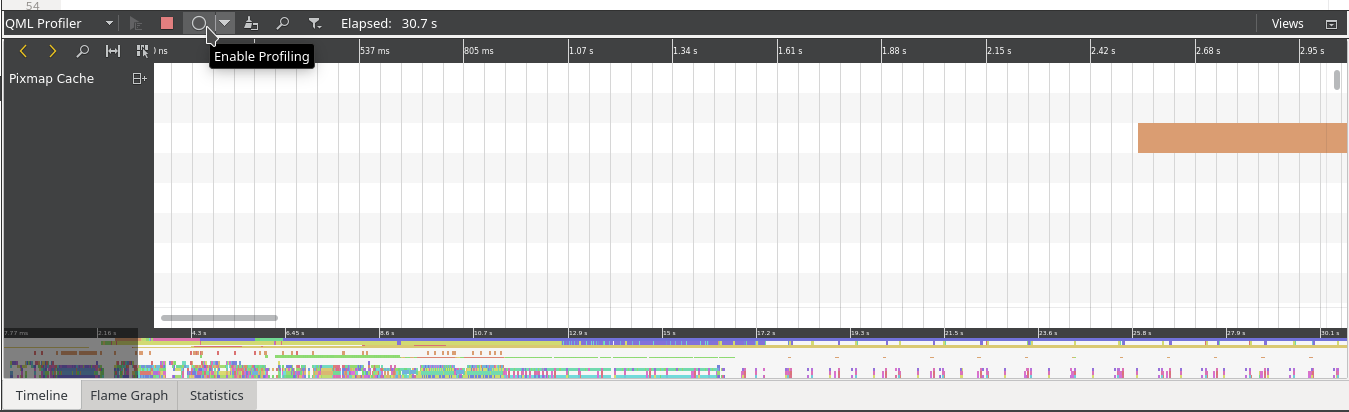
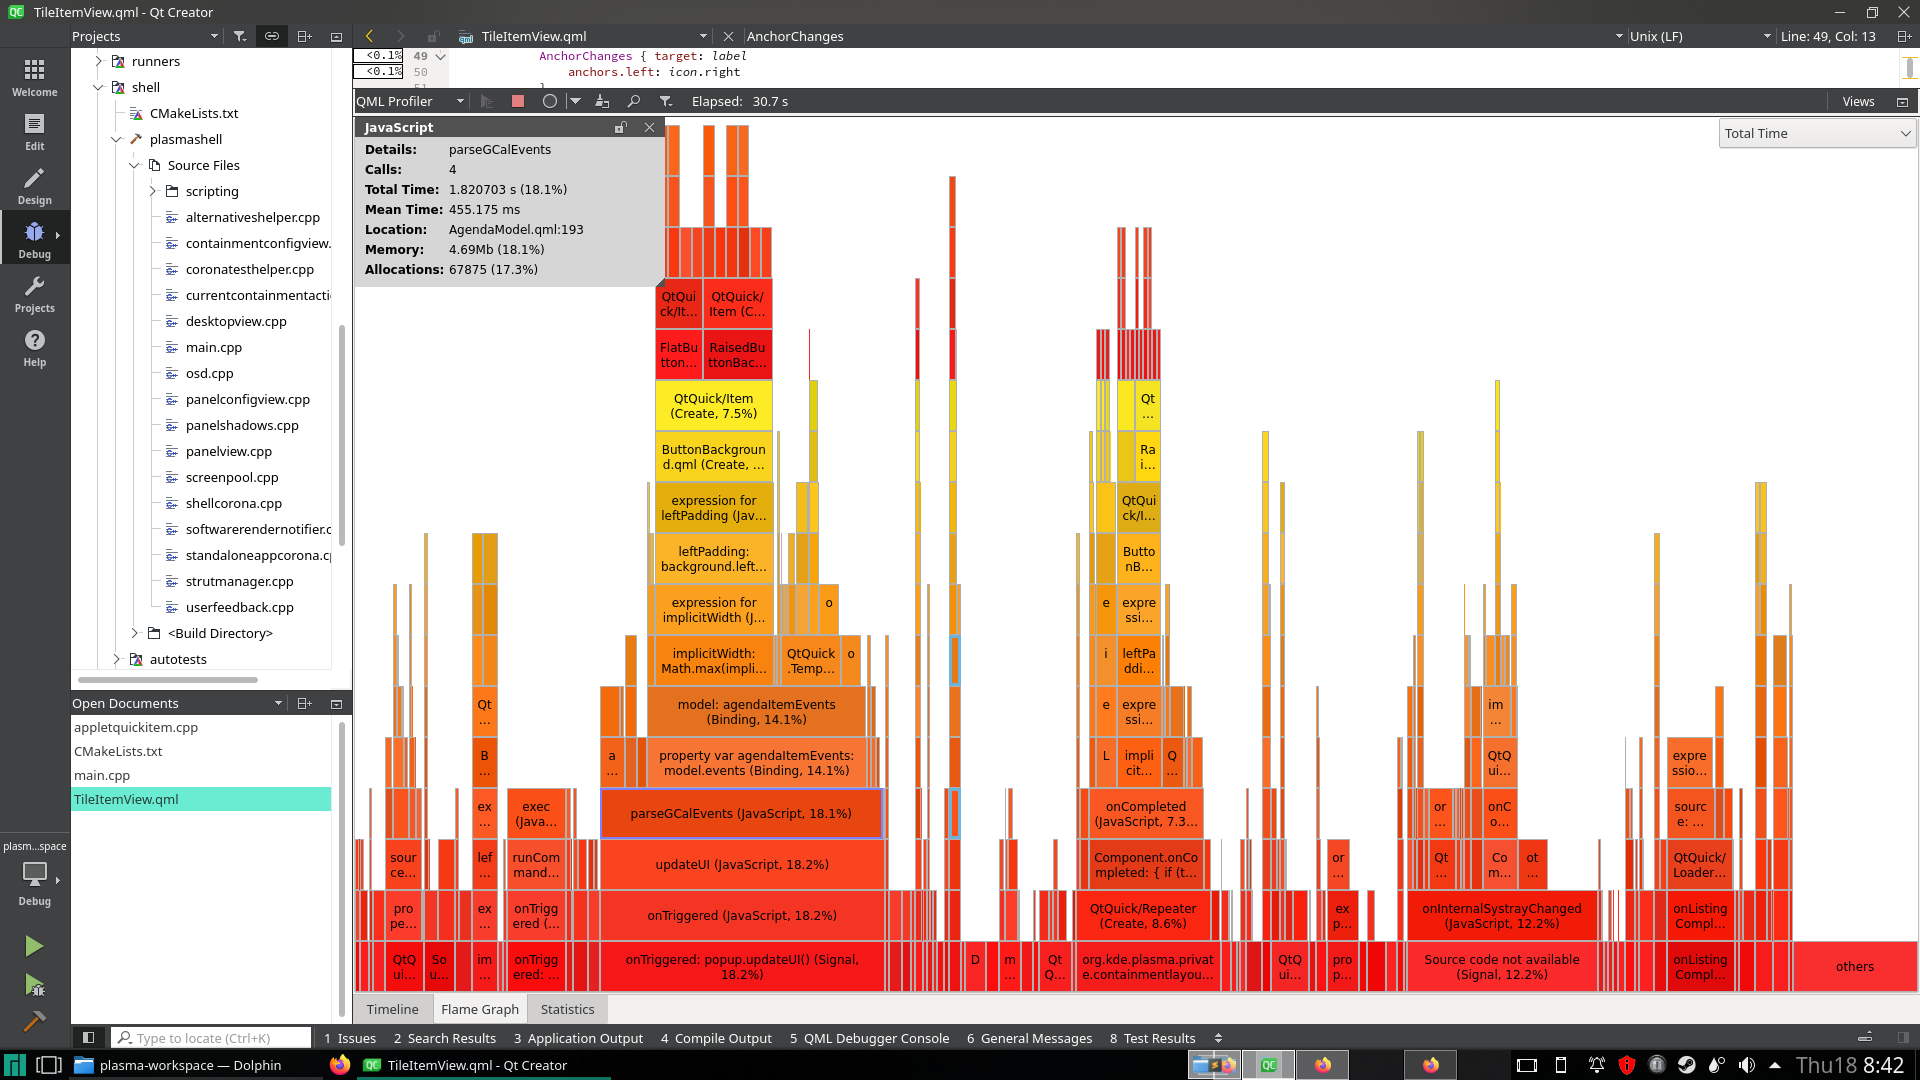
You’ll notice a number of sections in the timeline. “Pixmap Cache”, “Scene Graph”, “Memory Usage”, “Debug Messages”, “Animations”, “Compiling”, “Creating”, “Binding”, “Handling Signal”, and “JavaScript”.
The timeline can be scrolled, and clicked to view the details. Use Ctrl+MouseWheel to zoom if something is hard to click. As you can see in the video, it seems it took a while to load my wallpaper and the tile images in my Tiled Menu app launcher. This “Pixmap Cache” is likely asynchronous however since it’s IO.
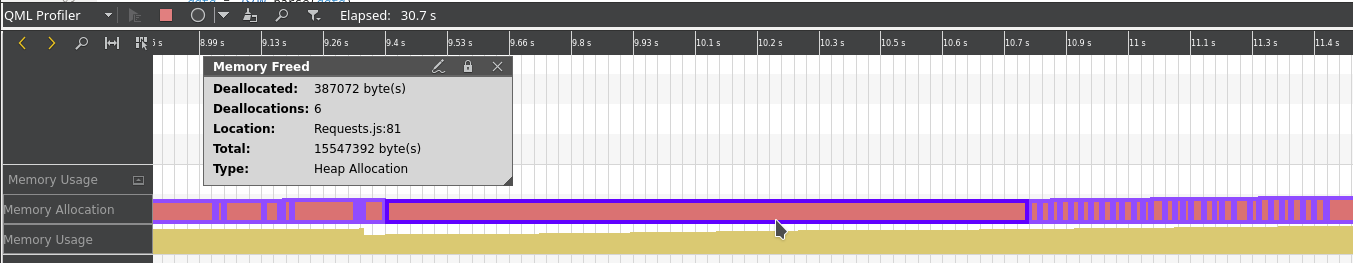
There’s an interesting Memory Usage section which should be useful.
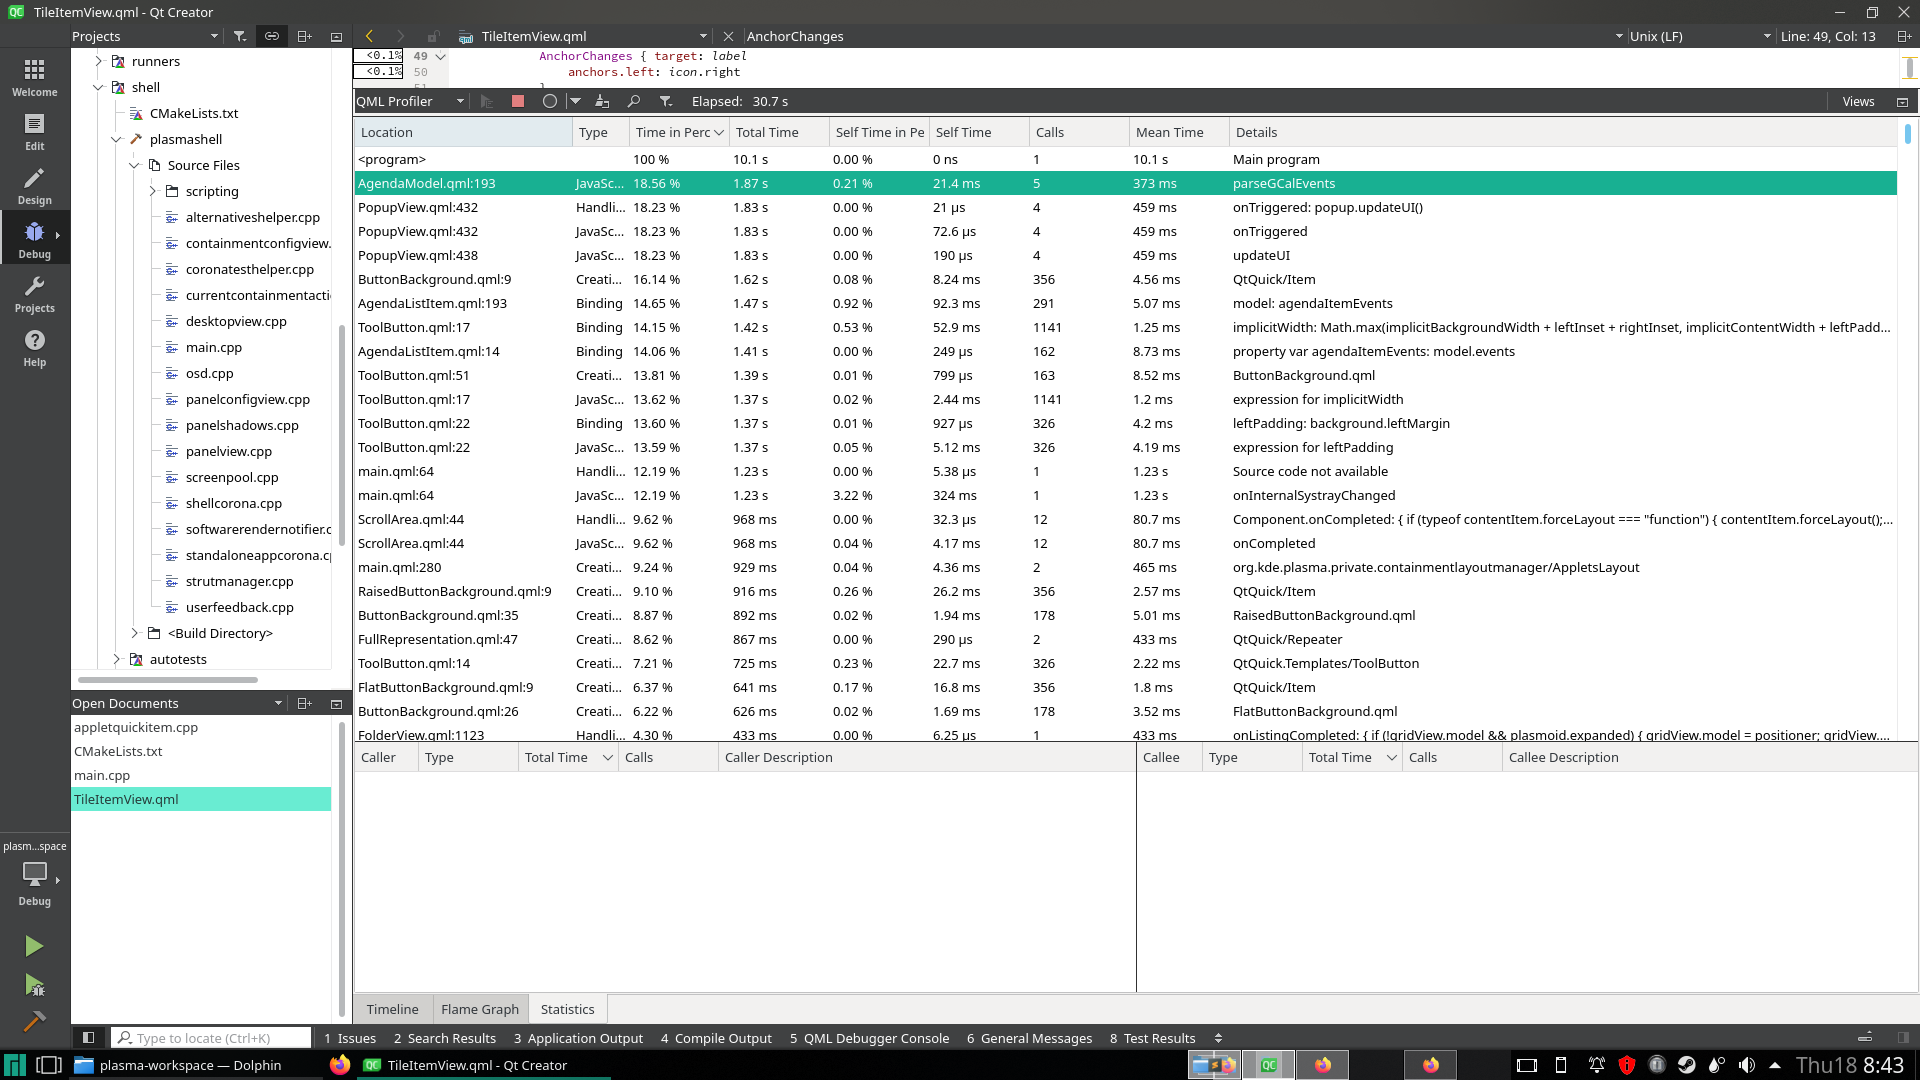
There’s also a “Flame Graph” and “Statistics” tab which tell me that my Event Calendar widget code could be better. Functions are starting, then ending much later.