QML Profiling Plasmashell
Since my last article on the subject, I’ve found out that plasmashell has an environment variable that enables QML Profiling which makes debugging Plasma far simpler.
Open up the Konsole app (Meta+T), then paste the following (Ctrl+Shift+V) to restart plasmashell in debug mode:
PLASMA_ENABLE_QML_DEBUG=1 plasmashell --replace -qmljsdebugger=port:5555,5565,services:CanvasFrameRate
You should see the following in the logs.
QML debugging is enabled. Only use this in a safe environment.
QML Debugger: Waiting for connection on port 5555...
PLASMA_ENABLE_QML_DEBUG=1tells plasmashell to allow debugging.-qmljsdebugger=configures what data to expose and how to connect to it.port:5555,5565,will select an open port between5555..5565services:CanvasFrameRateis the code name for the “QML Profiler”. Qt Creator also enablesEngineControl,DebugMessages,DebugTranslationbut they are unrelated to data collection.
To read more about the -qmljsdebugger read the Qt documentation:
https://doc.qt.io/qt-5/qtquick-debugging.html#starting-applications
qmlprofiler
qmlprofiler is a terminal command we run in a separate Konsole window/tab (Meta+T).
 Kubuntu Kubuntu KDE Neon KDE Neon
|
|
 Manjaro Manjaro Arch Arch
|
|
 OpenSUSE OpenSUSE
|
|
 Fedora Fedora
|
|
 Gentoo Gentoo
|
|
qmlprofiler --interactive --record off --attach localhost --port 5555 --output ~/Desktop/plasmashell_$(date +%s).qtd
Breaking this command down:
--interactiveallows us to enter commands to start recording, or save recordings to file.--record offtells it to not record when we connect toplasmashell--attach localhostswitches to connecting to an already running program--port 5555which port to connect to--output ~/Desktop/plasmashell_$(date +%s).qtdMake sure you save as a.qtdfiletype or you won’t be able to open it in Qt Creator.
For more help, type qmlprofiler --help.
After running the command you should see:
Connected to localhost:5555. Wait for profile data or type a command (type 'help' to show list of commands).
Recording Status: off
>
Type help then hit Enter.
> help
The following commands are available:
'r', 'record'
    Switch recording on or off.
'o [file]', 'output [file]'
    Output profiling data to <file>. If no <file>
    parameter is given, output to whatever was given
    with --output, or standard output.
'c', 'clear'
    Clear profiling data recorded so far from memory.
'f [file]', 'flush [file]'
    Stop recording if it is running, then output the
    data, and finally clear it from memory.
'q', 'quit'
    Terminate the target process if started from
    qmlprofiler, and qmlprofiler itself.
Since plasmashell creates huge amounts of profiling data, we’ll only start recording after plasma is loaded to make it easier to track down the issues occurring after it’s fully loaded.
> record
Recording started
When you’ve finished triggering the memory leak. Type flush to save to the output file we specified when qmlprofiler was run.
> flush
Data written to /home/chris/Desktop/plasmashell_1649368701.qtd.
Please note that the longer the command runs, the more data the output file uses. A simple 10 second test can create a file 2 Mb. If you do lots of interactions over 60 seconds, it can be 20 Mb. The larger the file, the longer it’ll take to load in Qt Creator, and the more RAM is needed to preview it. At launch, Qt Creator uses 60-120Mb of RAM. After loading a 2Mb .qtd file, it uses 300Mb of RAM. After loading the 20Mb .qtd file, it used 600Mb of RAM and took 10 seconds to load in Qt Creator.
Compress/Share
If you’re a user, at this point you’ll need to compress the file before uploading it.
Right click the file > Compress > Here (as TAR.GZ)
Profiling Plasmashell startup
Previously, we skipped recording when plasma started up to minimize the file size. However a KDE dev might want you to profile the startup, so use these commands instead.
PLASMA_ENABLE_QML_DEBUG=1 plasmashell --replace -qmljsdebugger=port:5555,5565,block,services:CanvasFrameRate
qmlprofiler --interactive --attach localhost --port 5555 --output ~/Desktop/plasmashell_$(date +%s).qtd
You’ll notice we added block to -qmljsdebugger=. It will pause plasmashell from loading until qmlprofiler connects to it. Without block, plasmashell continues loading and display the panels + wallpapers.
If you’re a developer, you can even turn this into a one liner with:
PLASMA_ENABLE_QML_DEBUG=1 qmlprofiler --interactive --output ~/Desktop/plasmashell_$(date +%s).qtd plasmashell --replace
All you need to do is type f then Enter (ignore the plasma logs) and it’ll save to file.
Loading Trace Files In Qt Creator
If you haven’t yet installed Qt Creator:
|
KubuntuKDE Neon
|
|
|
ManjaroArch
|
|
|
OpenSUSE
|
|
|
Fedora
|
|
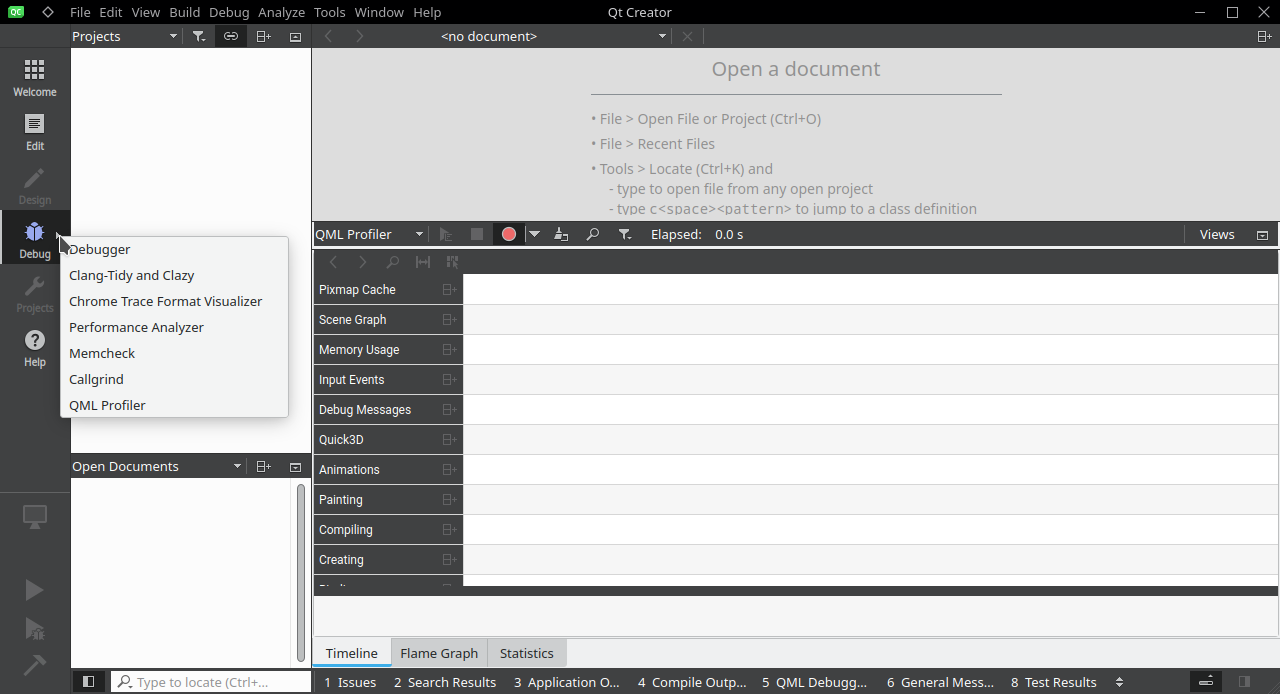
Open Qt Creator.
Click the triangle on the Debug tab, a context menu should appear. Select QML Profiler.
Right click the empty timeline area > Load Trace File
Select your .qtd file. It takes a few seconds to load small trace files. Larger files take a minute.
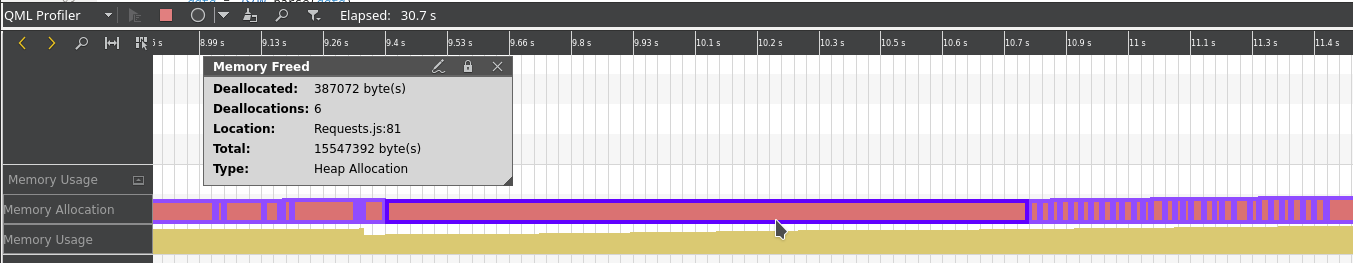
You’ll notice a number of sections in the timeline. “Pixmap Cache”, “Scene Graph”, “Memory Usage”, “Debug Messages”, “Animations”, “Compiling”, “Creating”, “Binding”, “Handling Signal”, and “JavaScript”.
The timeline can be scrolled, and clicked to view the details. Use Ctrl+MouseWheel to zoom if something is hard to click. As you can see in the video, it seems it took a while to load my wallpaper and the tile images in my Tiled Menu app launcher. This “Pixmap Cache” is likely asynchronous however since it’s IO.
There’s an interesting Memory Usage section which should be useful.
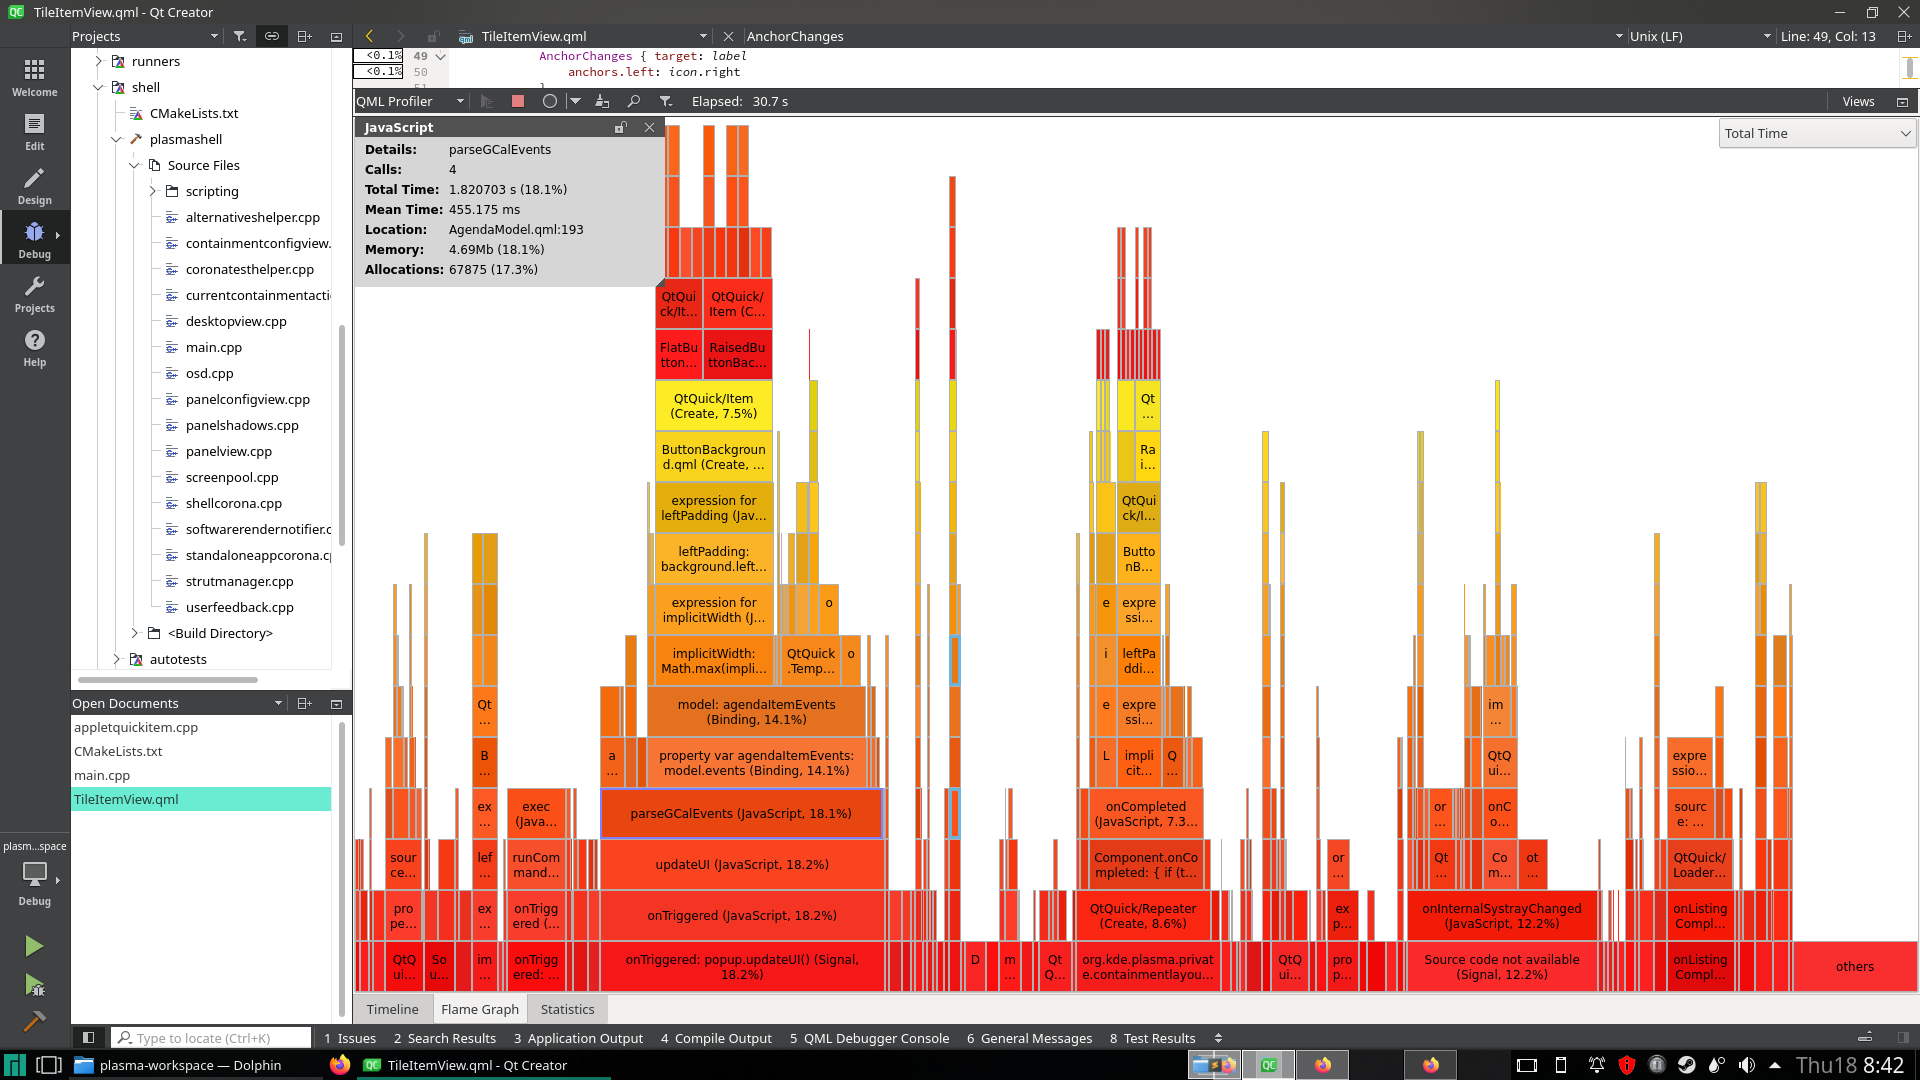
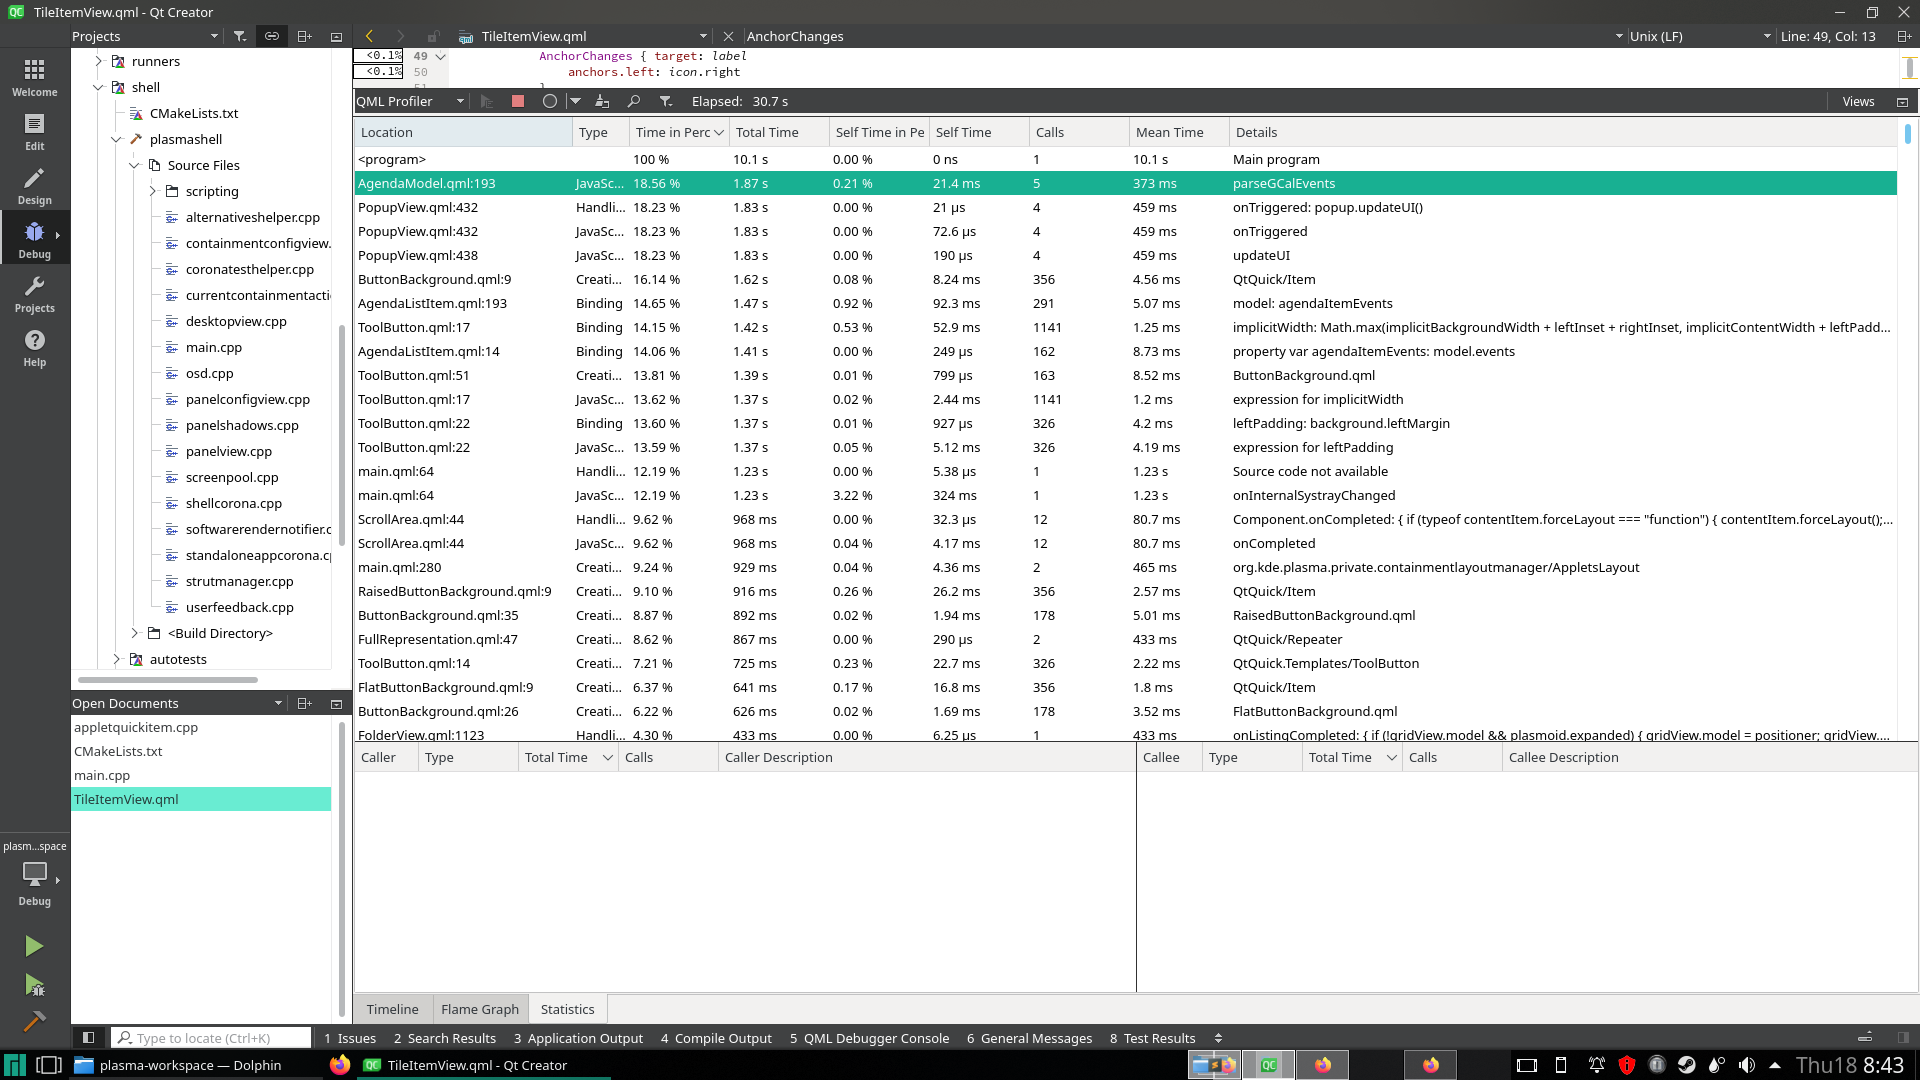
There’s also a “Flame Graph” and “Statistics” tab which tell me that my Event Calendar widget code could be better. Functions are starting, then ending much later.
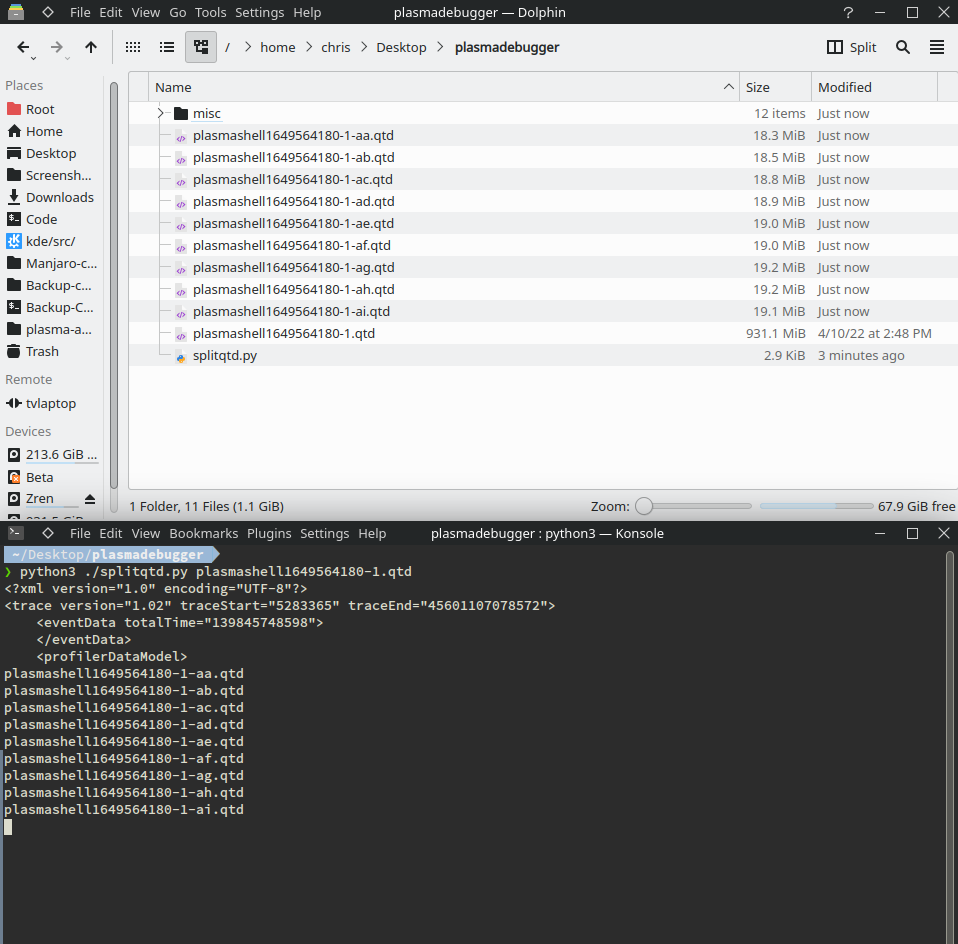
Opening Huge 100Mb Log Files
If you leave a plasmashell debugging session running for several hours or overnight, the .qtd log file can grow to nearly 1000Mb when the data is flushed to file. In order to open a file that large in Qt Creator, it would take several days and tons of RAM.
For such cases, I wrote a simple python3 script to split a large .qtd log file into multiple 20Mb files.
https://gist.github.com/Zren/b4d2c234b5f84228e2475e4c0f0d2592
- Download the
splitqtd.pyscript by opening the Raw file on Gist then Saving Page As (Ctrl+S).
https://gist.githubusercontent.com/Zren/b4d2c234b5f84228e2475e4c0f0d2592/raw/splitqtd.py - Run
python3 ./splitqtd.py ~/Desktop/plasmashell_1234567890.qtd